


Inside the Washington Post’s popularity prediction experiment
In the distributed age, news organizations are likely to see their stories shared more widely, potentially reaching thousands of readers in a short amount of time. At the Washington Post, we asked ourselves if it was possible to predict which stories will become popular. For the Post newsroom, this would be an invaluable tool, allowing editors to more efficiently allocate resources to support a better reading experience and richer story package, adding photos, videos, links to related content, and more, in order to more deeply engage the new and occasional readers clicking through to a popular story.
Here’s a behind-the-scenes look at how we approached article popularity prediction.
Data science application: Article popularity prediction
There has not been much formal work in article popularity prediction in the news domain, which made this an open challenge. For our first approach to this task, Washington Post data scientists identified the most-viewed articles on five randomly selected dates, and then monitored the number of clicks they received within 30 minutes after being published. These clicks were used to predict how popular these articles would be in 24 hours.
Using the clicks 30 minutes after publishing yielded poor results. As an example, here are five very popular articles:


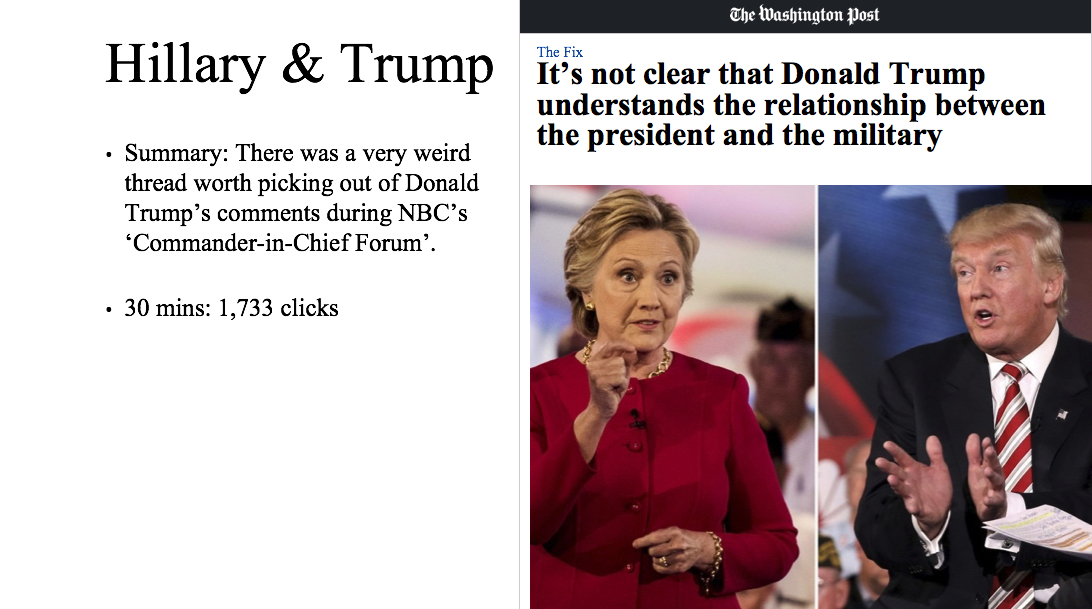
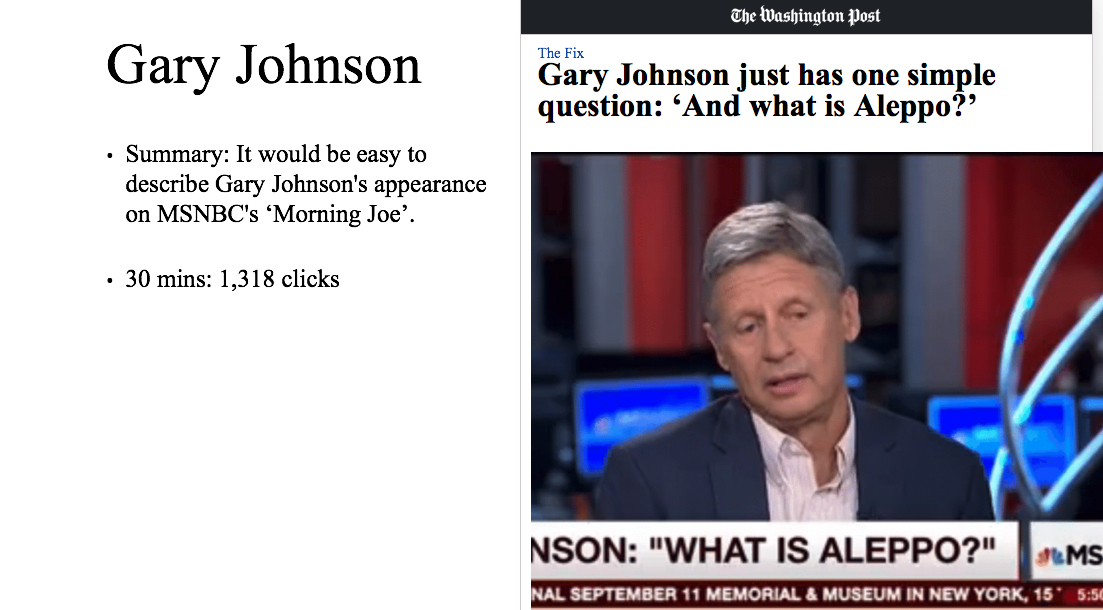
Table 1 lists the actual number of clicks these five articles received 30 minutes and 24 hours after being published. The takeaway: looking at how many clicks a story gets in the first 30 minutes is not an accurate way to measure its potential for popularity:
Articles
|
# clicks @ 30mins
|
# clicks @ 24hours
|
9/11 Flag
|
6,245
|
67,028
|
Trump Policy
|
2,015
|
128,217
|
North Carolina
|
1,952
|
11,406
|
Hillary & Trump
|
1,733
|
310,702
|
Gary Johnson
|
1,318
|
196,798
|
Prediction features
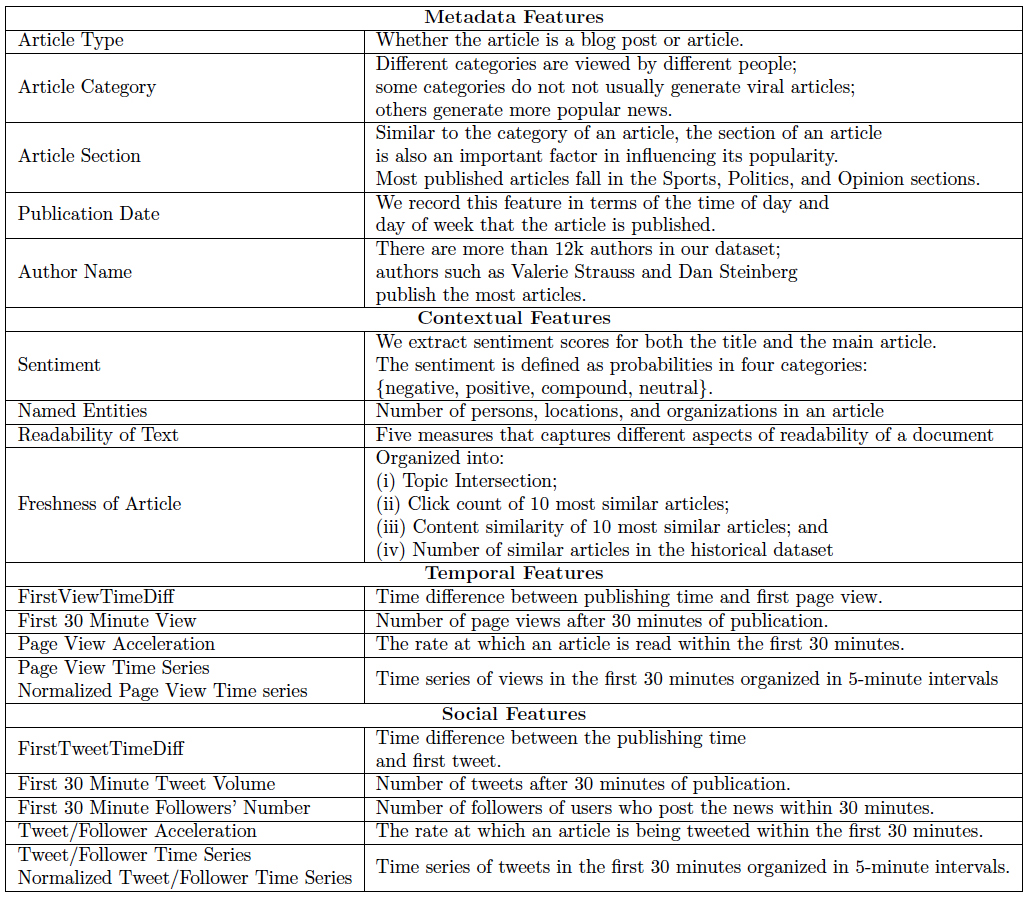
In this prediction task, Washington Post data scientists have explored four groups of features: metadata, contextual, temporal, and social features. Metadata and contextual features, such as authors and readability, are extracted from the news articles themselves. Temporal features come mainly from an internal site-traffic collection system. Social features are statistics from social media sites, such as Twitter and Facebook.
Figure 6 lists all of the features we used in this prediction task. (More details about these features can be found in the paper, on which we we collaborated with Dr. Naren Ramakrishnan and Yaser Keneshloo from Discovery Analytics Center Virginia Tech, "Predicting the Popularity of News Articles.")
Regression task
Figure 7 illustrates the process that we used to build regression models. In the training phase, we built several regression models using 41,000 news articles published by the Post. To predict the popularity of an article, we first collected all features within 30 minutes after its publication, and then used pre-trained models to predict its popularity in 24 hours.

Evaluation
To measure the performance of the prediction task, we conducted two evaluations. First, we conducted a 10-fold cross validation experiment on the training articles. Table 2 enumerates the results of this evaluation. On average, the adjusted R2 is 79.4 (out of 100) with all features. At the same time, we realized that metadata information is the most useful feature aside from the temporal clickstream feature.
Features
|
Predicted R2
|
Baseline
|
69.4
|
Baseline + Temporal
|
70.4
|
Baseline + Social
|
72.5
|
Baseline + Context
|
71.1
|
Baseline + Metadata
|
77.2
|
All
|
79.4
|
The second evaluation was done in production after we deployed the prediction system at the Post. Using all articles published in May 2016, we got an adjusted R2 of 81.3% (out of 100).
Figure 8 shows scatter plots of prediction results for articles published last May. The baseline system on the left uses a single feature: the total number of clicks at 30 minutes. On the right is a more complete system using all features listed in Figure 1. The red lines in each plot are the lower and upper error bounds. Each dot represents an article, and, of course, ideally all dots would fall within the error bounds. As you can see, there are many more errors in the baseline system.

Production deployment
We built a very effective regression model to predict the popularity of news articles. The next step was to deploy it to production at the Post.
The prediction quality relies on the accuracy of features and speed to obtain them. It is preferred to build this prediction task as a streaming service to collect up-to-date features in real time. However, this comes with a challenge. We have to process tens of millions of points of click data every day to predict the popularity of thousands of Post articles. A streaming infrastructure facilitates the fast prediction task with minimal delays.
Architecture
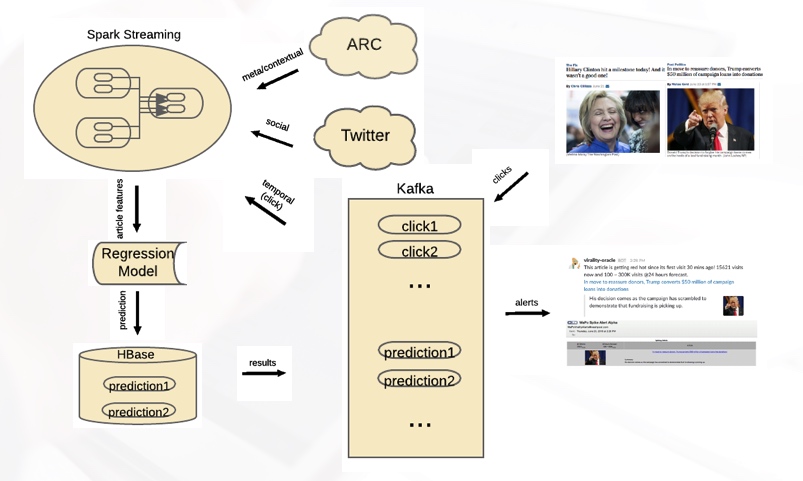
Figure 9 illustrates the overall architecture of the prediction service in the production environment at the Post. Visitors who read news articles generate page view data, which is stored in a Kafka server and then fed into back-end Spark Streaming services. Other features such as metadata and social features are collected by separate services, and then fed into the same Spark Streaming services. With all these collected features, prediction is done with a pre-trained regression model, and results are stored to an HBase server and also forwarded to the Kafka server. The Post newsroom is also alerted of popular articles via Slack and email.
Spark Streaming in clickstream collection
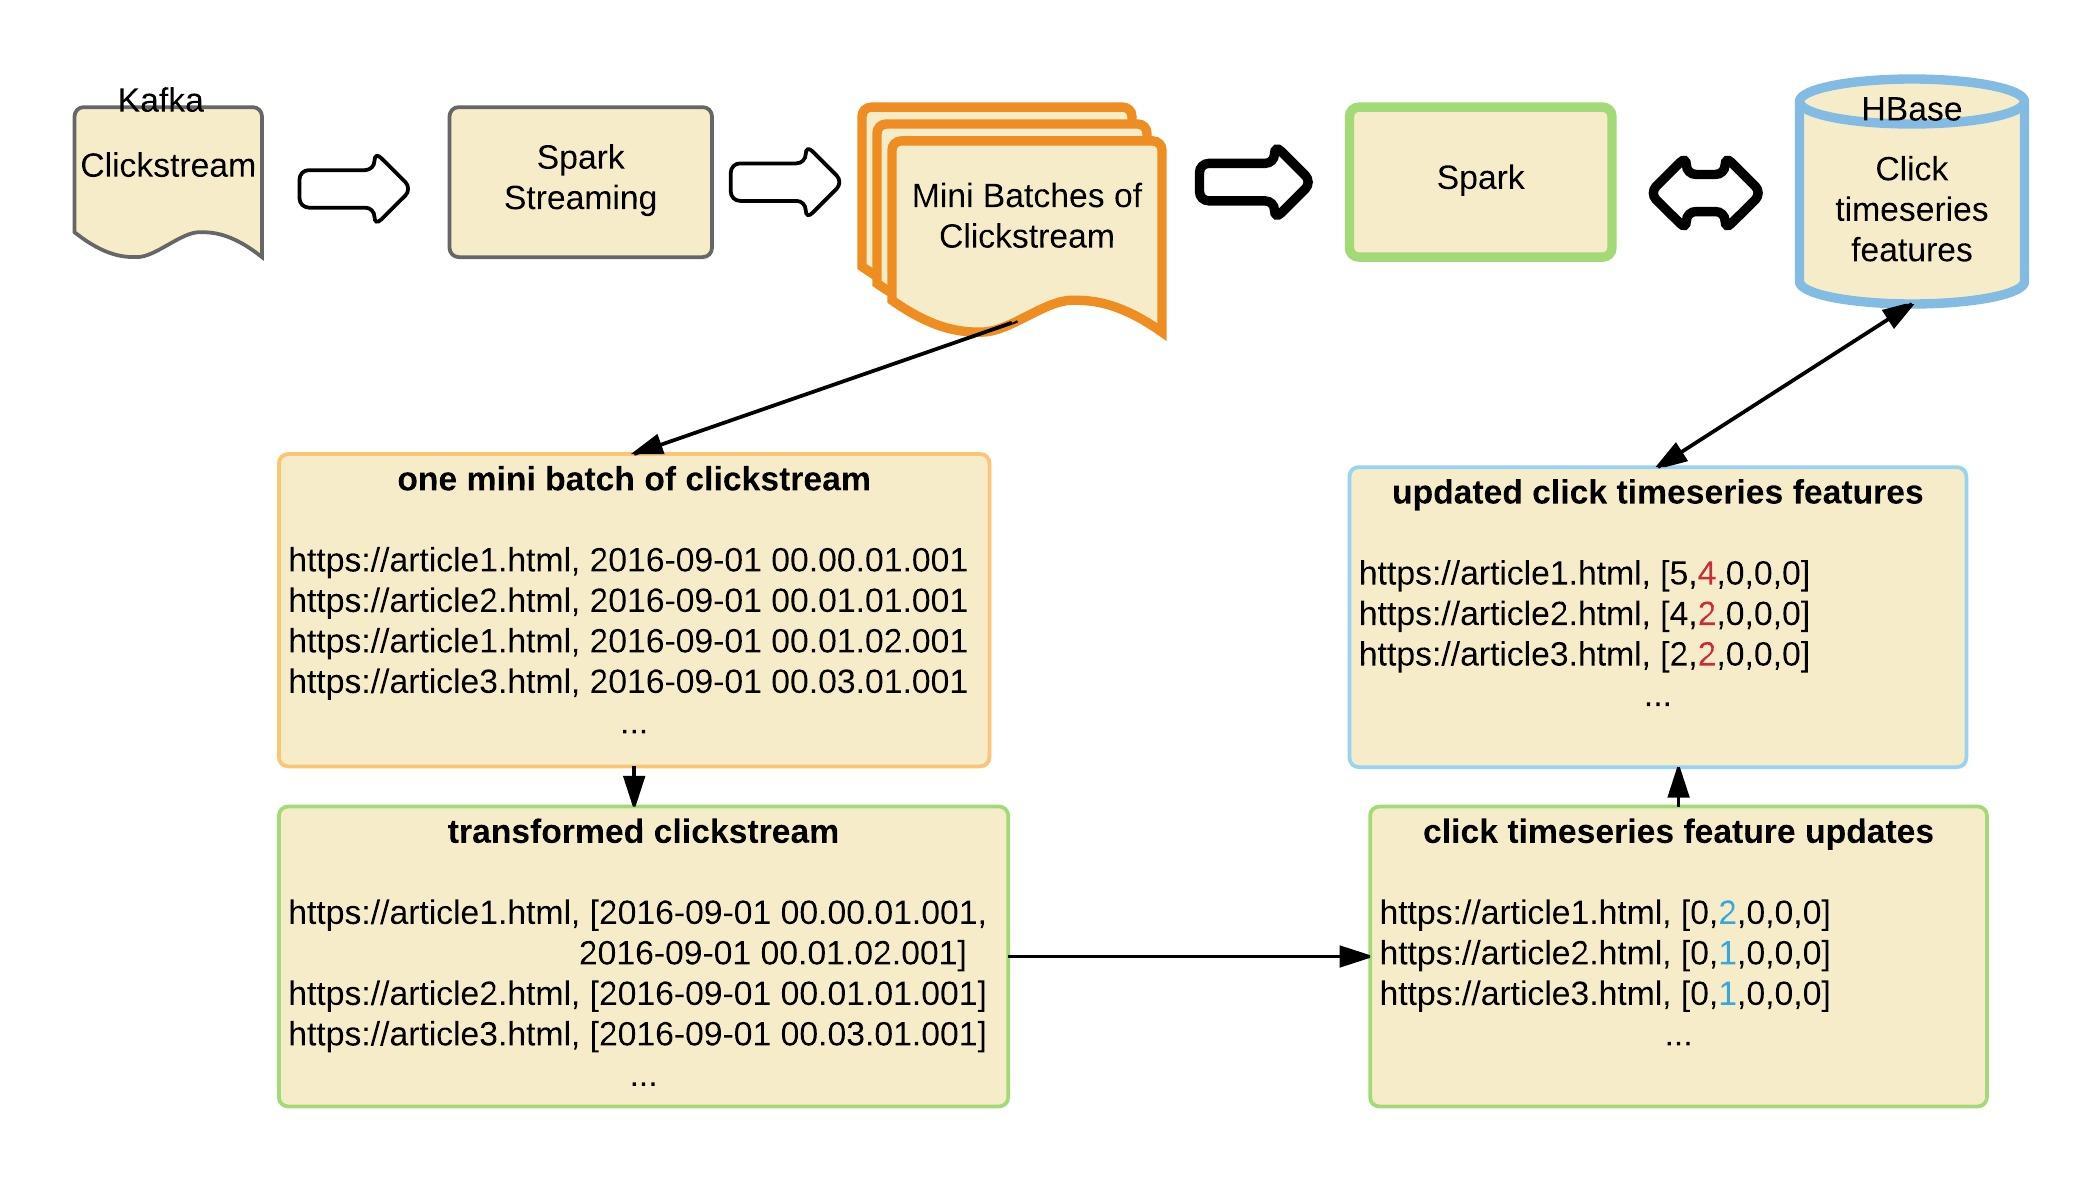
The Spark Streaming framework is used in several components in our prediction service. Figure 10 illustrates one process we use Spark Streaming for: to collect and transform the clickstream (page view) data into prediction features.
The clickstream stored in Kafka is fed into the Spark Streaming framework in real time. The streaming process converts this real time stream into smaller batches of clickstream data. Each batch is converted into a simplified form, and then another format the pre-trained regression model can easily consume. In the end, page view features are stored in the HBase database.
System in the real world
Washington Post journalists monitor predictions using real-time Slack and email notifications. The predictions can be used to drive promotional decisions on the Post home page and social media channels.
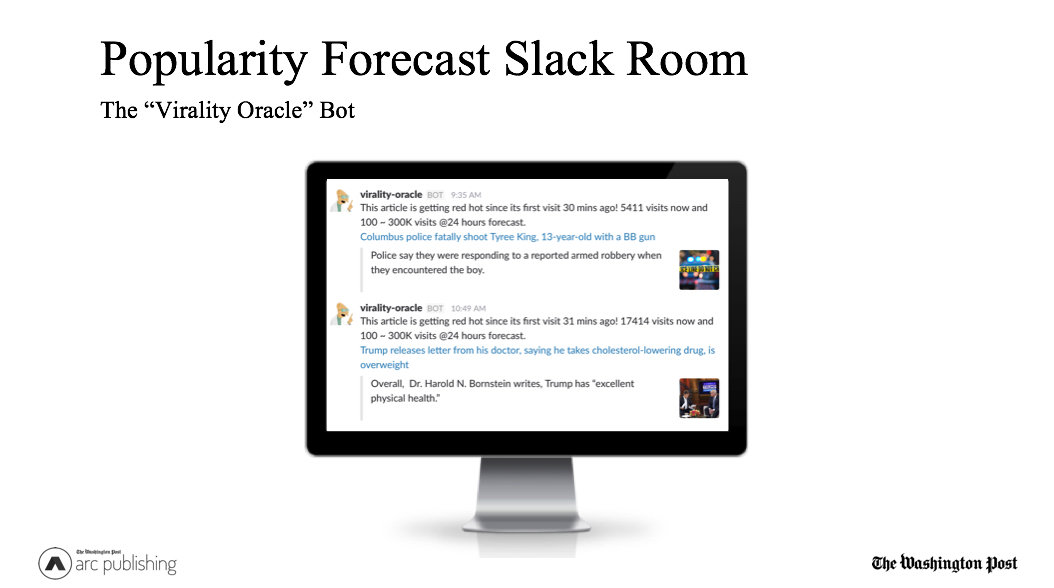
We created a Slack bot to notify the newsroom if, 30 minutes after being published, an article is predicted to be extremely popular. Figure 11 shows Slack notifications with the current number and forecasted number of clicks in 24 hours.
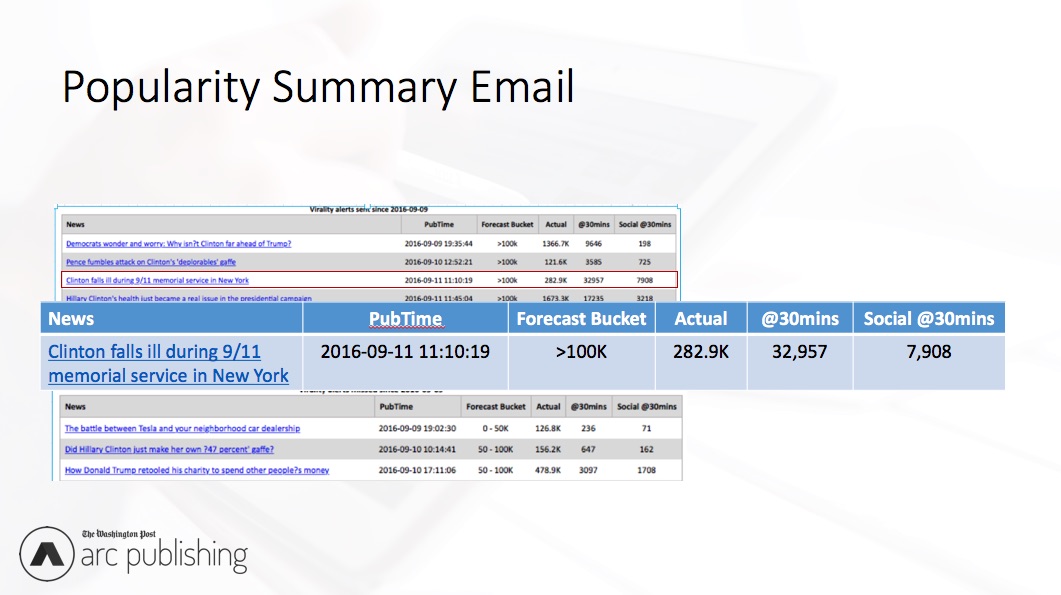
We also automatically generate emails that gather that day’s predictions and summarize articles’ predicted and actual performance at the end of the day. Figure 12 shows an example of these emails. This email contains the publication time, predicted clicks, actual clicks in first 30 minutes, actual clicks in first 24 hours, and actual clicks from social media sites in first 30 minutes.
In addition to this being a tool for our newsroom, we are also integrating it into Washington Post advertising products such as PostPulse. PostPulse packages advertiser content with related editorial contents, and delivers a tailored, personalized advertisement to the target group. Figure 13 shows an example of this product in action, in which an advertiser’s video on 5G wireless technology is paired with editorially produced technology articles. A member of the advertising team puts the package together and receives candidate editorial articles as recommendations to include in the package. These articles are ranked according to relevance and expected popularity.

Practical challenges
We faced two main challenges when we deployed this service to production. First is the scale of the data. Each day, we process a huge and increasing amount of data for prediction; the system must scale with it, using limited resources. We profile the service’s performance in terms of execution time, and identifying that persistent storage (HBase) is a significant bottleneck. Whenever we have to store or update HBase, it is expensive. To reduce this, we accumulate multiple updates before we physically update HBase. This runs the risk of some potential data loss and less accurate predictions if the service crashes between two updates to HBase. We’ve tuned the system and found a good balance so updates are not too delayed.
The second challenge is dependencies on external services, which we use to collect various features. However, if these external APIs are not reachable, the prediction service should still be available. Thus, we adopted a decoupled microservice infrastructure, in which each feature collection process is a separate microservice. If one or more microservices are down, the overall prediction service will still be available, just with reduced accuracy until these external services are back online.
Continuous experiments and future work
Moving forward, we will explore a few directions. First, we want to identify the time frame in which an article is expected to reach peak traffic (after running some initial experiments, the results are promising). Second, we want to extend our prediction to articles not published by the Washington Post. Last but not least, we want to address distribution biases in the prediction process. Articles can get much more attention when they are in a prominent position on our home page or spread through large channels on social media.


0 comments